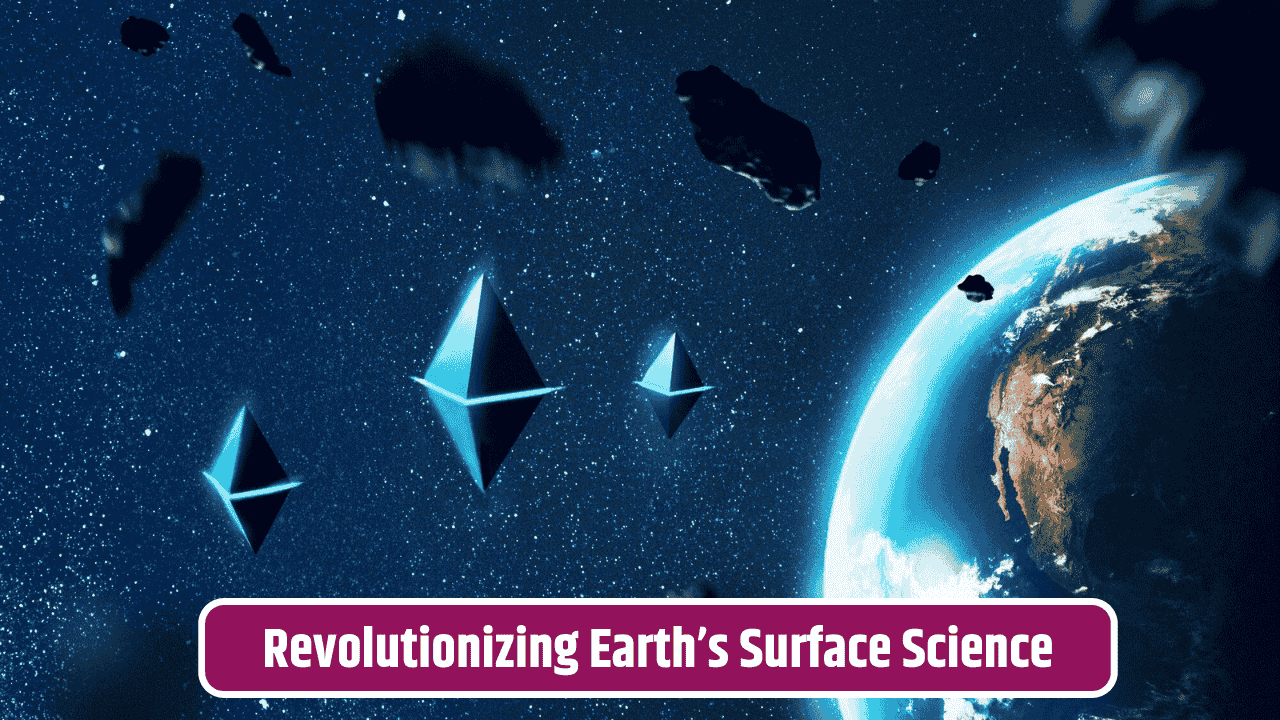
It’s funny—most of us scroll through satellite images on Google Maps like it’s nothing, zooming in on our childhood home or the street corner where we grab coffee. But behind those crisp visuals is a tidal wave of data so massive it’s reshaping how scientists, governments, and even businesses understand the very skin of our planet: Earth’s surface. This isn’t just about pretty pictures—it’s about tracking climate change, predicting floods, monitoring urban sprawl, and even mapping hidden mineral deposits. Big Data is turning the ground beneath our feet into one of the richest sources of insight we’ve ever had.
Table of Contents
Satellites, Sensors, and the Data Deluge
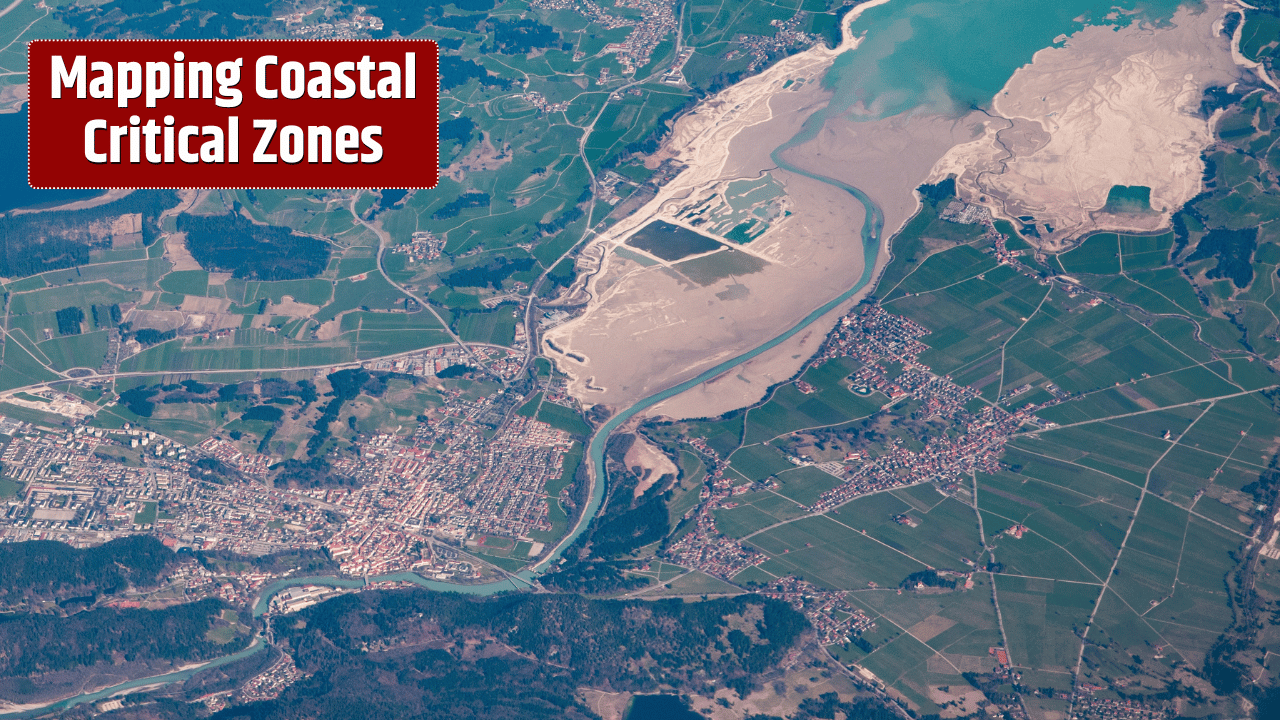
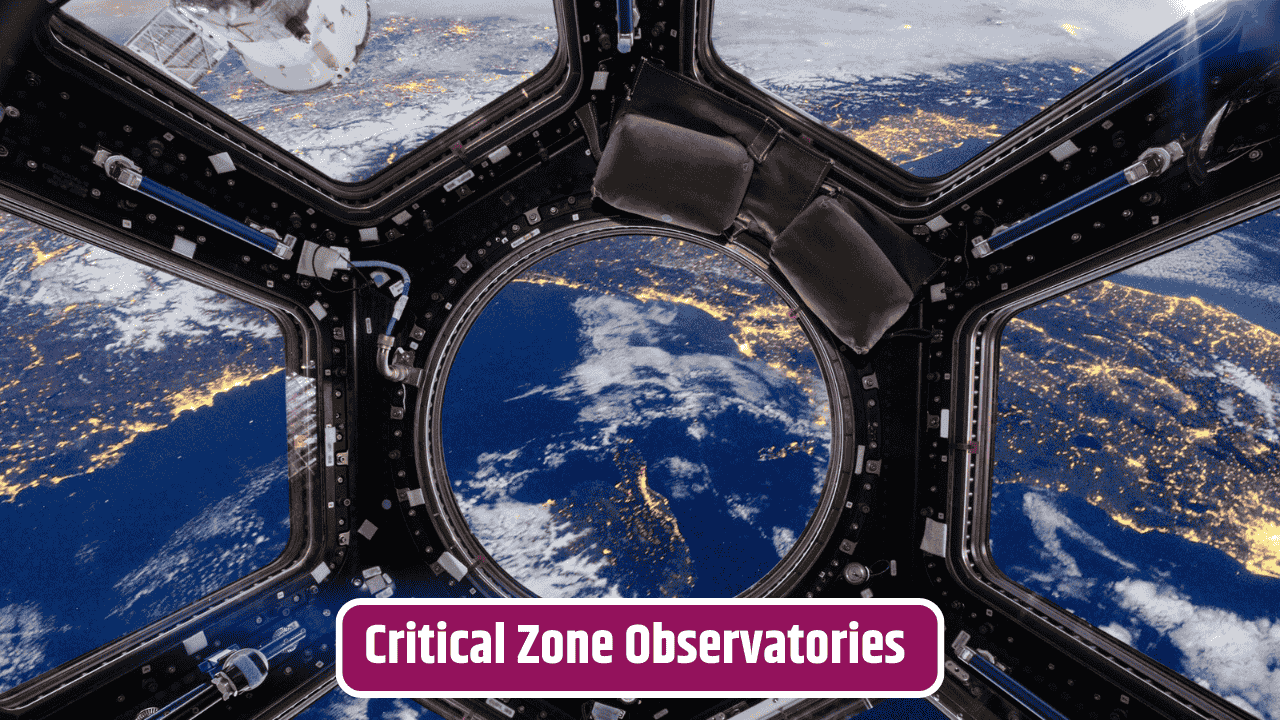
A couple of decades ago, remote sensing meant grainy satellite shots that scientists had to squint at for clues. Now? The European Space Agency’s Copernicus program and NASA’s fleet of Earth-observing satellites are pumping out petabytes of high-resolution data daily. Every cloud shadow, every inch of shrinking glacier, every wildfire scar is being recorded.

Then there are ground-based sensors—seismic stations, drones, even smartphones—that add layers of data points. Together, this information forms a living, breathing digital twin of Earth’s surface. It’s like watching the planet’s diary unfold in real-time.
| Data Source | What It Tracks | Example Use Case |
|---|---|---|
| Satellites (optical & radar) | Land cover, vegetation, water bodies, ice sheets | Monitoring deforestation in the Amazon |
| Drones & UAVs | High-resolution, local terrain mapping | Disaster relief after earthquakes |
| IoT Sensors | Soil moisture, air quality, temperature | Precision agriculture |
| Seismic/GPS stations | Tectonic movement, subsidence | Earthquake prediction & safety planning |
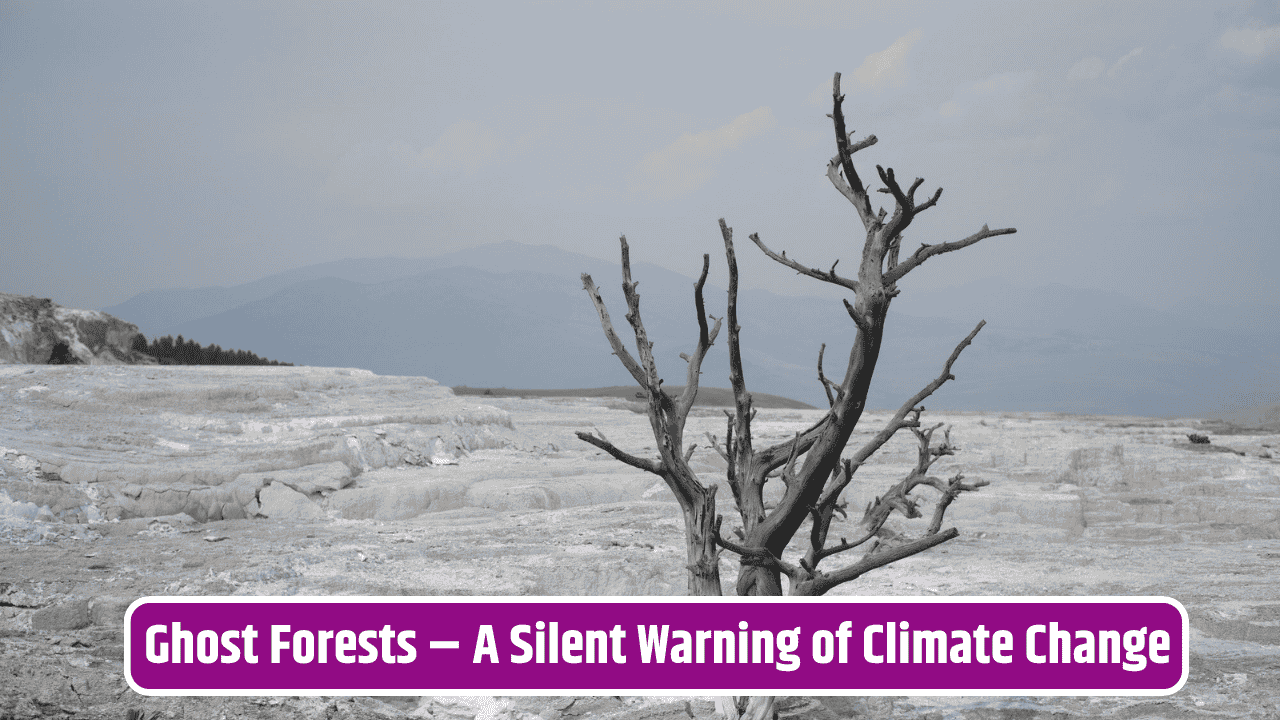
Climate Change: No Longer Just A Theory
Big Data isn’t just feeding research papers—it’s reshaping policy. By analyzing decades of surface data, scientists can track how ice caps are thinning, deserts are spreading, and sea levels are creeping higher. The U.S. Geological Survey has entire datasets showing land surface changes, helping city planners brace for flooding or farmers adapt to shifting rainfall patterns.
And here’s the kicker: it’s not just governments paying attention. Insurance companies, for instance, are tapping into surface-change analytics to calculate risk premiums for coastal properties. Big Data is literally rewriting how much your house might be worth in 20 years.
Urban Growth and Hidden Patterns

Cities look chaotic from the ground—traffic jams, construction noise, sprawl. But from above, Big Data reveals patterns. Algorithms can show how urban heat islands form, how traffic flows affect air pollution, and where informal settlements pop up faster than official maps can keep up.
In India, for example, satellite monitoring has been used to track unplanned construction and land encroachments. This helps governments respond quicker (though bureaucracy is still… well, bureaucracy). On the flip side, tech giants like Google use Earth-surface data to refine navigation apps, offering smoother traffic predictions for the rest of us.
Natural Disasters: Predict, Don’t Just React
One of the most powerful uses of Big Data is disaster preparedness. By combining historical records with real-time satellite feeds, scientists can spot early warning signs of landslides, volcanic activity, or floods. The National Oceanic and Atmospheric Administration (NOAA) uses such systems to monitor hurricanes, giving coastal communities precious hours—or even days—of preparation time.
It’s not about avoiding disaster altogether (we’re not there yet), but minimizing damage. Think of it like seeing storm clouds and grabbing your umbrella before you get soaked.
The Business Angle Nobody Talks About
Here’s where it gets interesting: Big Data on Earth’s surface isn’t just for scientists and governments. Mining companies use it to scout deposits without drilling as much. Farmers use it to maximize crop yields with precision irrigation. Even fashion brands (yes, really) are tracking cotton-growing regions to anticipate supply chain issues caused by droughts.
In other words, Earth’s surface data is no longer just a scientific curiosity—it’s big business.
The Privacy and Ethics Question
Of course, with great data comes… great creepiness. While monitoring forests or glaciers seems harmless, the same technologies can monitor people, too. High-resolution surface data can reveal human activity in stunning detail. The line between environmental tracking and surveillance isn’t always clear, and that’s a debate policymakers are still grappling with.
FAQs
How does Big Data help fight climate change?
By analyzing surface changes over time, Big Data shows where glaciers, forests, and coastlines are shrinking, helping guide climate policies.
Is this data available to the public?
Yes. NASA, USGS, and ESA provide open-access datasets for researchers, businesses, and even curious individuals.
Can Big Data really predict earthquakes?
Not perfectly. It helps identify stress points in tectonic plates, but earthquakes remain difficult to predict with exact timing.
How do farmers benefit from Earth surface data?
Farmers use soil moisture sensors and satellite imagery to fine-tune irrigation, improve yields, and cut water waste.
Are there risks of misuse?
Yes. While the main goal is environmental monitoring, the same technologies could be used for surveillance or corporate exploitation.